FENCE — Leveraging Graph Database for detection of Fair Play Violation at Dream11
- Published on
Dream11 takes pride in being a unique platform that enables over 110 million fantasy sports users to demonstrate their skills, showcase their sports knowledge, and connect deeper with the sport they love by being an owner of a fantasy sports team. While many of our users participate in free contests, we at Dream11 have a specialised system in place so that users participating in every contest including the paid ones, win in a fair, square and transparent manner.
FENCE (short for Fairplay Ensuring Network Chain Entity) is Dream11’s in-house fraud detection system. It is powered by a graph database that’s responsible for processing and maintaining all models and heuristics so that Fair Play Violations are detected timely and efficiently. In this blog, you will find how we create, maintain and access this graph database in batch mode.
Violation of the Fair Play policy
The Fair Play Policy at Dream11 defines a number of rules which users must adhere to in order to maintain a fair playing ground for all. Defying these rules constitutes a Fair Play Violation (“FPV”). A major kind of Fair Play Violation is creation of multiple or duplicate accounts by a user on the platform in order to abuse referral or promotional cash bonus schemes. While we are incentivising our users to introduce their friends to our platform, a handful of users misuse these schemes by creating duplicate accounts for availing the benefits repeatedly. In such cases, we need to identify and map these multiple accounts to a single person. These multiple registrations associated to a single source (“Multiple Account”) also lead to skews in our business KPIs and hence, have to be kept in check and excluded from all analysis. Thus, there is a constant need to create a scalable system that can detect Multiple Accounts.
Indicators of Fair Play violation or frauds
When it comes to the violation of the Fair Play policy, a single heuristic or model alone is never sufficient to detect and prevent all bad actors. Hence, we have come up with a number of models as well as heuristics to resolve this issue. The problem statement is to establish linkages between users so that clusters or micro-clusters of Multiple Accounts are identified. Essentially, with each new user flowing into the system, we need to run all our models and heuristics against our entire existing database of more than 100 million users to find connected users and then assign the highlighted user accounts to the cluster they belong to. This helps in appropriate attribution of the accounts in violation and collective action can be taken.
A deep dive into the journey of implementation
Building the FENCE on Graph Database


Data loading
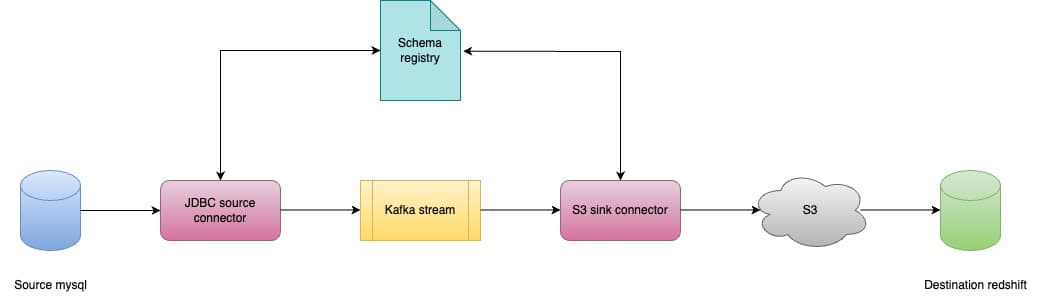
- Our source of data is MySQL transactional tables, and to use it for analytical purposes, we have created a pipeline to continuously flow data from MySQL to our data warehouse Redshift. For that, we have used Debezium connectors to pull data from MySQL databases to Kafka in real-time, and then S3 sink connectors to flush to our data lake Amazon S3. Now, we have the data in the unprocessed format in the data lake from where ETLs are done to move it to our warehouse Amazon Redshift.
- At this point, we have all the required data in our data warehouse. We proceed by running complex and configurable heuristics on tables of Redshift to form the edges (complex association) between 100 million uses in the format which is required by Neptune DB. Then, we load it all to Neptune DB. This complete movement of data from Redshift to Neptune DB over multiple scripts is scheduled using airflow with a configurable run schedule
- Our initial approach was to do a full refresh of Neptune DB on every run but as the volume of data we were dealing with was too high in number (more than 100 million nodes from Day 1), we had to move it in an incremental process.
- To push data to Neptune DB, we took the following approach
Persist previous copy of Graph as T-1 dataset on Redshift
On next run, recompute whole Graph on Redshift & persist as T dataset
Smartly calculate the delta based on these two datasets based on MD5 hash change
Propagate the delta to Neptune DB using delete insert strategy on Neptune DB
- In Data loading flow we have also implemented a gateway for various teams where they can run their own heuristics/models and directly give us the association between the users. Using the above-mentioned workflow, Nodes & Edges get loaded to Neptune DB.
Accessing Graph DB
- A group of duplicate/fake accounts created by the same person or group of people with illicit intentions is what we classify as Fair Play Violating clusters. The graph combines all FPV indicators and helps in the detection of such clusters/micro-clusters hidden in our base of genuine users
- In order to highlight these FPV clusters, we traverse the graph to retrieve connected components of nodes (users) with FPV indicator edges linking them to one another across multiple degrees of connections. A particular connected component would contain all the IDs that are linked to the same account and hence, enable us to cluster these Multiple Accounts into fraud pools to take collective action
Incremental Data Access
- To avoid redundancy and to actively keep checking, the cluster generation process is an incremental batch process in which, the list of all the newly added nodes (users) in the graph DB is fetched based on their ingestion time in each run
- This list of nodes acts as the starting points for cluster generation. For each node in the list of initial nodes, we fire a gremlin query to find all the nodes directly or indirectly connected to it via FPV indicator edges
- Once we have the connected component we assign a unique cluster ID to all the nodes of the connected component. In this step, we also create a cluster profile with some descriptive statistics about the cluster like the counts of different types of FPV indicating linkages found in that cluster, size of the cluster, etc
- Cluster attributes are computed to add a level of explainability to our fraud detection systems. This information provides visibility into the reasons for detection which makes it easier for Risk and CS to answer any queries or concerns of the user
Gremlin
- Using gremlin provides us with the flexibility to select the indicators of our choice while traversing the graph and use those edges for cluster generation with minimal code changes.
Spark
- The cluster generation process for all initial set of nodes is parallelized and all cluster profiles generated are combined into a single DataFrame using a spark job which then writes the user ID and cluster-ID mapping into a Redshift database via JDBC(Java Database Connectivity,) spark connector.
Redis Caching to avoid redundant parallel queries in incase of big clusters
- If a node is already included in a cluster, it should not be used as a starting point, as it would create two major problems for us:
- It would create two different clusters with unique IDs but they will have the same set of users which would later have to be de-duplicated
- Neptune has a maximum limit on concurrent web socket connections, so running a lot of long redundant parallel queries exhausts the web sockets available causing the job to run for hours and occupying memory
- This is where our Redis caching mechanism comes into the picture. All the nodes retrieved as part of the connected component are cached into a Redis database. Whenever a node is to be passed as a starting point for cluster generation, it is first checked for in the cache. If we encounter a cache hit, then the node is skipped. Else, the connected component for the new node is retrieved. At the end of each incremental run, the Redis cache is flushed for the next run
- The network structure given below is a visualization of a sample FPV cluster retrieved from the FENCE graph DB. The purple nodes are users and the edges are the different FPV linkages that cascaded together to uncover this cluster.


Our experience with Neptune DB
- Loading bulk data to Neptune is a cakewalk as AWS provides the API to load, monitor the loading, and very good documents to implement them
- Great support by Amazon like providing multiple APIs, a custom multi-threaded script on Github to delete all nodes and edges from Neptune DB, and complete documentation.
- Has access to Amazon CloudWatch metrics for easy load monitoring and debugging.
- Is suitable for use cases where queries are restricted to pointed access patterns. It is not recommended for aggregation use cases for a large amount of data.
- Default values for timeouts of Neptune DB are very small and we had to change them for our use case.
- Error tracking could be tricky while loading data to Neptune DB.
- Time taken for data loading to Neptune From S3 changes drastically with the number of files it has to load from. Loading from a single large file will take a lot less time than loading from many small files.
What’s next?
Amazon Neptune Graph DB Set-Up proved to be a one-stop scalable solution for our FPV use case. Currently, a dedicated team is alerted about any FPV clusters detected for them to take action. Future scope includes increasing the detection rates of such FPV clusters by adding more FPV indicators to the graph and improving accuracy to completely automate the actioning and enable tighter integration with the product.
Stay tuned for the second part of this blog, where we will explain how we have made this whole setup in real-time!
Looking for hands-on experience in working with the world’s largest fantasy sports platform with over 110 million users? Join the Dream11 team by applying here.
- Authors

- Name
- Dream11
- @Dream11Engg